Historical case study · September 2020
One question.
A connected portfolio.
A supplier supports work across several departments. Which investments depend on it? What measures govern those investments—and which projects and activities sit beneath them?
This earlier US government IT example follows questions through connected records. Its value is seeing how the next question changes the view, while keeping the links back to the wider portfolio.
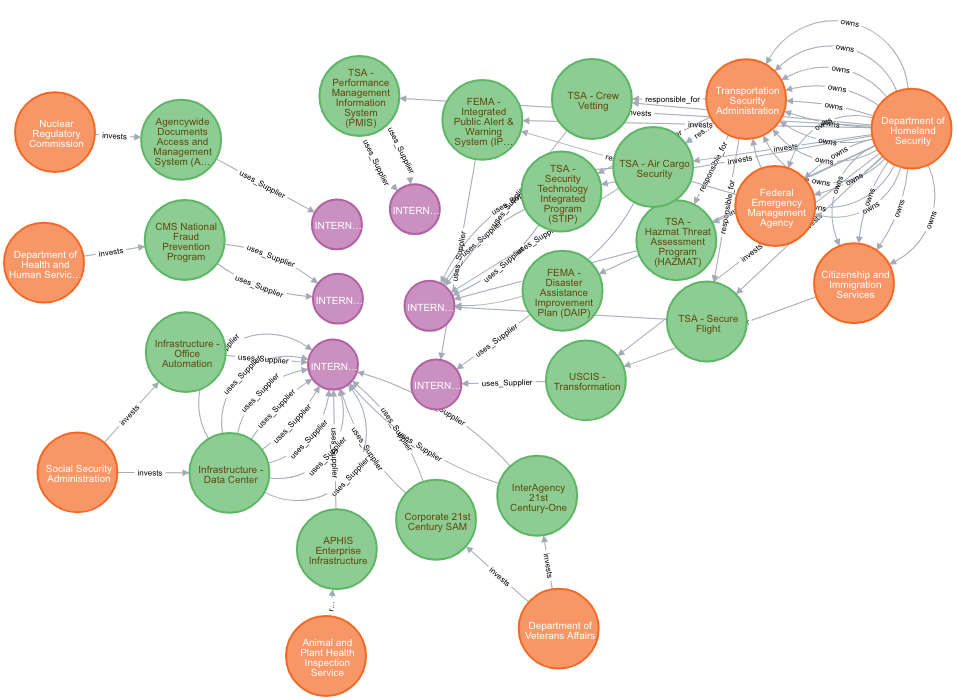
Lawrence Rowland’s September 2020 walkthrough reports a selected portfolio of 1,547 projects. It credits ProjectingSuccess / Project Hack and Oxford Business School for US government IT records described as 2013–2018, supplied for research and development only. Some incomplete rows were dropped. This guide was added 1 October 2026; it does not reproduce the old analysis or describe the current US portfolio.
Follow the supplier question · Read the model · Choose an implementation route · Find the original files
Follow the question, then check what you counted
Start with the purple supplier records, follow the links to green investments, then look at the orange organisations responsible for them. The original reports 16 investments/programmes across nine departments for IBM. That is a historical result, not a newly verified total. The source itself explains that separate supplier codes represent the same supplier.
The useful move is from “show me the portfolio” to “show me the relationships relevant to this decision”. It lets a manager inspect common supplier exposure without drawing every project at once. A recorded link establishes an association in this model; it does not establish criticality, capacity or the effect of a supplier failure.
The next question follows investment-to-metric links: what measures are being used on this work? The original query groups measurement categories. A count of matched rows can repeat an investment or metric when several paths reach it. Counting distinct programmes would be a different question requiring a clear identifier and counting rule.
Read the complete pictured walkthrough · Inspect the historical query sheet
One model, several useful views
The schema is the key to the pictures. Its node types distinguish agencies, bureaus, investments, projects, activities, contracts, suppliers, metrics, services and business functions. The main ownership/delivery chain reads agency → bureau → investment → project → activity. Other links connect delivery work to suppliers, measures and its organisational purpose.
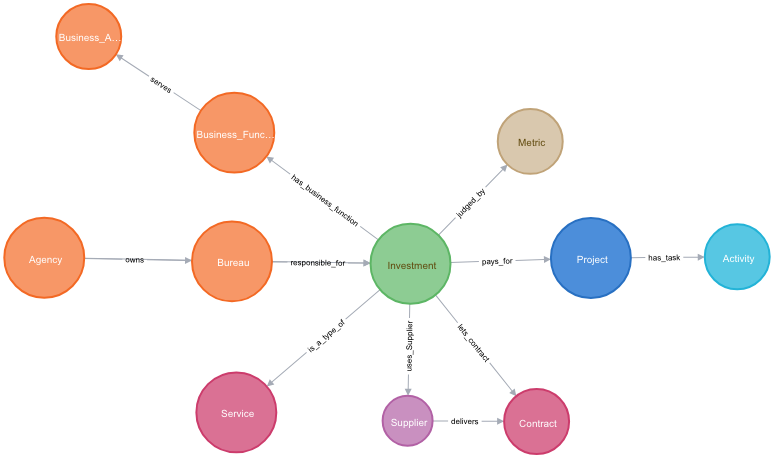
Investment is the dataset’s type name. It can include programmes or operational expenditure, so substituting “programme” everywhere would change the meaning. Business functions and services are also distinct classifications, not two labels for the same level.
Zoom into the Food and Drug Administration
The FDA view takes one bureau and the records connected to its investments. Read outward into projects and activities, and sideways into suppliers, contracts, metrics and classifications. The same records can support a bureau view, a supplier view or a question about late projects.

The separate Health hierarchy draft tries the complementary top-down explanation. It says both 11 and six bureaus; the saved Health export contains 11. Its second “Business Functions” heading describes the 29 Service nodes, distinct from 18 Business_Function nodes.
Why 437 investments and 721 investments can both appear
The full export contains 7,249 Investment records, of which 437 have names, and 1,910 Project records, of which 1,547 have names. The walkthrough’s headline figures match those named subsets. Its queries often explicitly require an investment name.
The Health export contains 721 Investment records, only 22 named, and 202 Project records, 108 named. The hierarchy draft uses the broader counts. Static inspection also finds unique stored investment identifiers within each export; these particular totals are not evidence of duplicate identifiers.
This is a concrete reason to ask “which records are included?” before comparing totals. We inspected the complete and Health export text; we did not rebuild the database or independently validate the real-world identities.
What the original results do—and do not—show
- Late projects and missing detail. The HR example reaches activities through delayed projects, then discovers missing activity records. A sparse picture can reveal missing data; it does not establish that the unshown work had no activities. Its text also switches between 6/8 programmes and 20/17 delayed projects.
- Delay is not a causal explanation. Summed project-delay days are not the elapsed delay of the portfolio. A small average start delay does not establish why activities finished late. The source’s suggestion that reliability explains delay is untested.
- Ratings and measures have specific meanings. The low-score query uses
Evaluation_by_CIO, not client satisfaction. The query for projects more than 100 days late counts metric-description occurrences in matched rows, not distinct programmes. Several projects can repeat the same metric. - Money and totals need reconciliation. The £82m caption conflicts with
Enhancement_spend_$m; no conversion is documented. Exported nodes, unique business identifiers and filtered query rows are different units. The walkthrough’s totals should not be silently reconciled with a different saved export.
These limits preserve a useful lesson: a graph makes relationships inspectable, but the meaning of a result still depends on identifiers, missing data, units and the question used to select it.
Start with the governance need, then choose the tools
A companion October 2020 note asks how an organisation’s ambitions, accountabilities and existing information should shape implementation. It works from governance needs → management information → data → integration → tools and processes. The graph can be a place to develop the model with people, even when the eventual operating system uses a relational database.

The other two sketches vary the organisation’s appetite and readiness for change. One proposes gradual additions to an existing delivery capability; the other starts with distributed accountabilities and master-data integration. Their product names are historical choices. The transferable question is which role each tool serves and how the model is handed over.

Read all three pictured governance scenarios and the original working questions →
The original files, with their roles made clear
- Read the explanation
- Complete illustrated walkthrough · Health hierarchy draft · Governance choices. Dated guidance accompanies their original text.
- Read or watch the earlier demonstration
- Original September 2020 PDF · FDA demonstration film (MOV). These are saved demonstrations, not a live database.
- Inspect the model construction
- Query sheet · Main notebook · Subgraph notebook. These are source artefacts to inspect; they have not been executed for this guide.
- Inspect editable graph exports
- Export inventory and unfinished setup notes. The full, Health and two FDA exports are distinct saved states. The old import/cleanup procedure has unresolved duplication and destructive statements, so it is not a supported setup recipe.
All original pictures, queries, notebooks, exports, the PDF and film remain in their source repository. Reading this page requires no installation. Reproducing the database would need separate work on data permission, environment compatibility, identifiers and import steps. Public availability does not extend the original research/development-only permission.
Back to data models in the Library · Back to the worked model guide