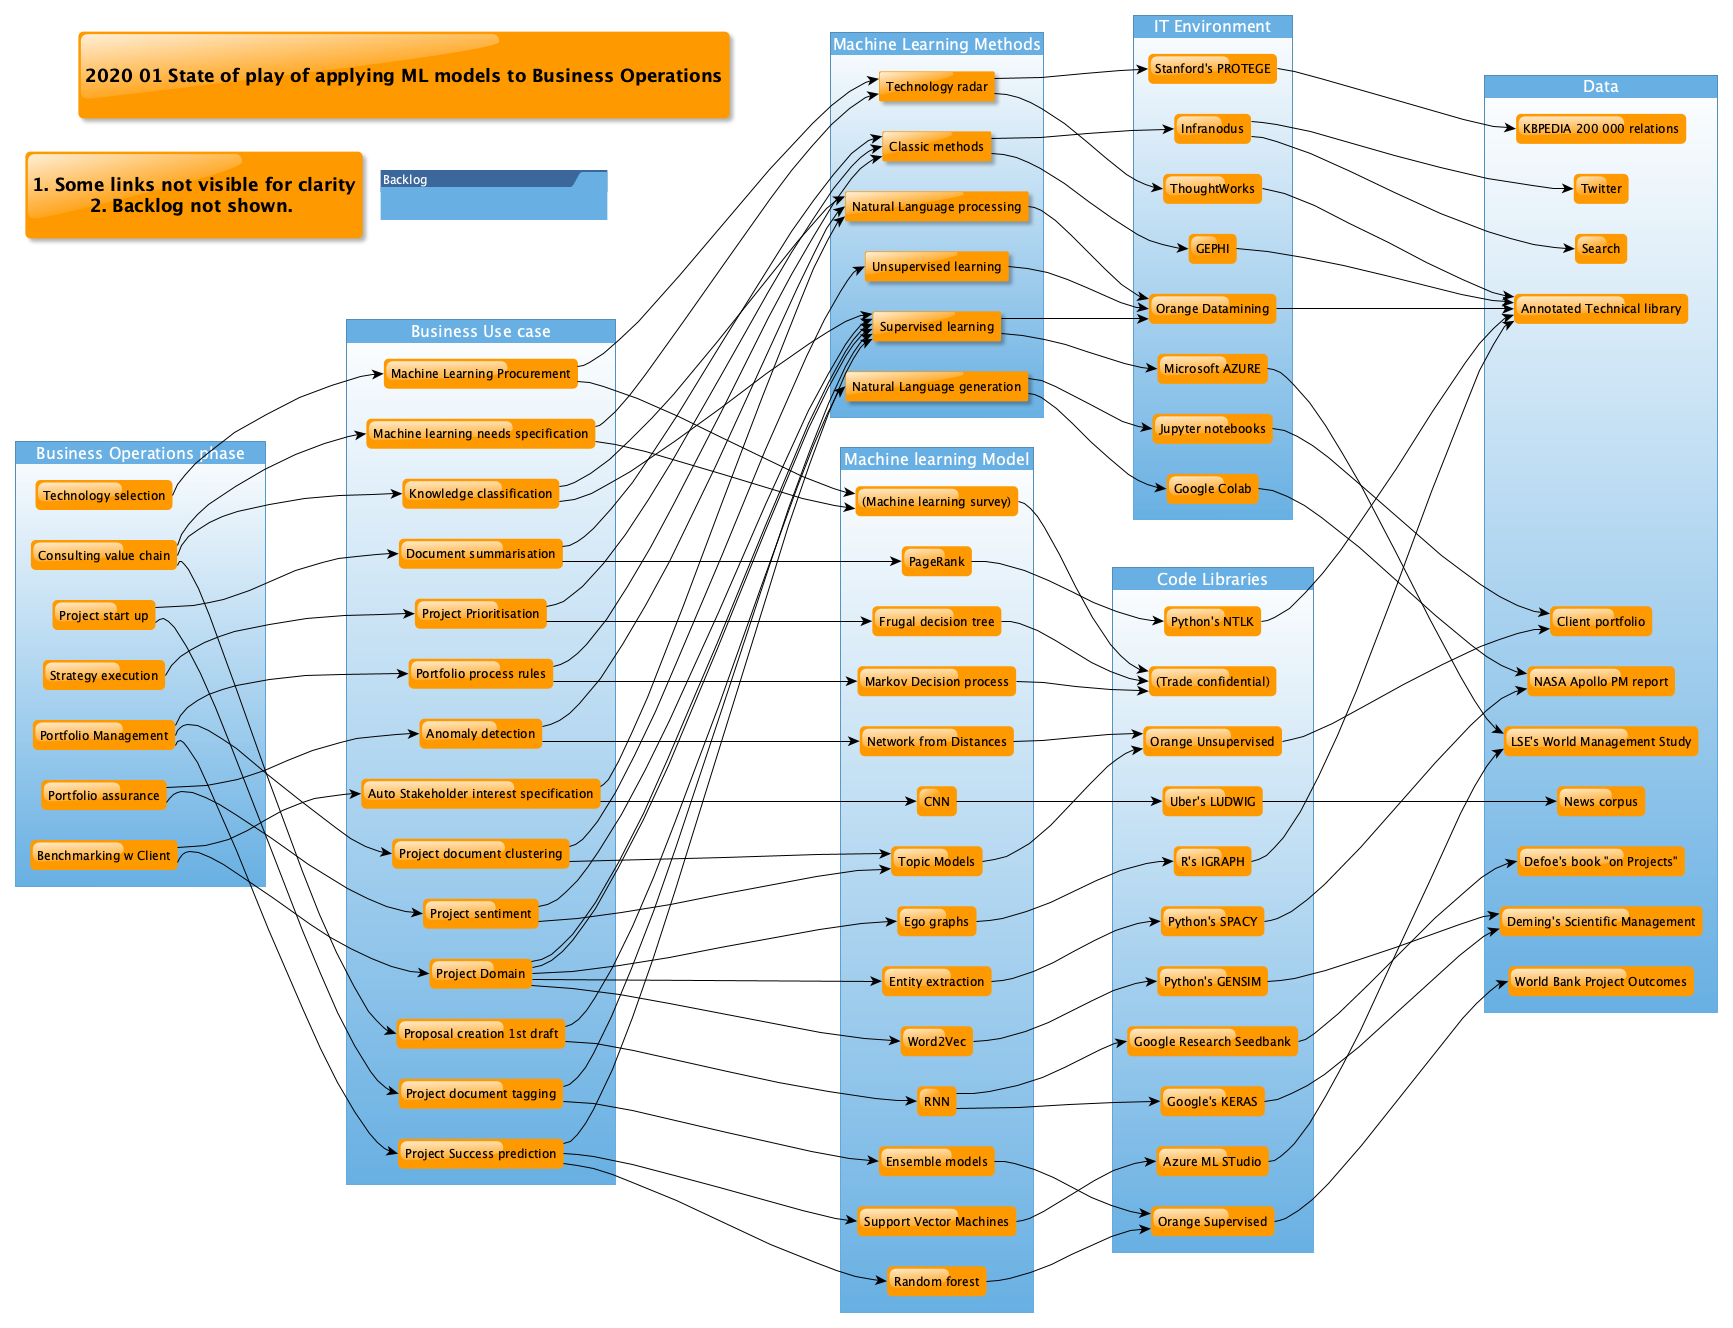
Do ask if you would like the code, data or graph for each of the examples.
|Strategy mapping for projects
link
 |Mapping a Target Operating Model for a project
  |
|:–|:–|
|Roadmaps for machine learning on projects
|
|:–|:–|
|Roadmaps for machine learning on projects
 |Fourth example|
Strategy mapping for projects

This graph has been visualised with a Javascript library. It had originally been created in Gephi. It is an example of how design thinking can help you come up with the right type of strategy solution once you have identified the problems you want to solve.
Mapping a Target Operating Model for a project

This graph has been visualised with a powerful graph visualisation service called Graphistry. It had originally been created in Neo4j, based upon an Insurance company case study.
Roadmaps for machine learning on projects
