Data models for project portfolios
- Purpose
- Code and library base
- Benefits
- Use cases
- Why have a data-model at all?
- Why use a graph database?
- At what portfolio level should this be applied ?
- Summary of start-up steps for application
- FAQs
- Acknowledgements
Purpose
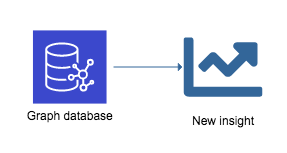
Manage and visualise a portfolio of projects with a data-model that is adapted to the team’s business context.
These repositories use freely available graph-database technology to manage project data.
![]()
Code and library base
To skip this guidance, go straight to these code and document libraries:
Benefits
-
A data-model shows how each project and programme type is described and fits together as a portfolio.
-
The right data-model for the business sets out a place for all the relevant content about each projects
-
The data-model can be tuned to match how all the business stakeholders understand your projects
-
The data-model relates outcomes, objectives, benefits, scope, KPIs etc, in the way that your business understands these features

Use cases
- Set-up a new portfolio Portfolio is new and team needs to move from whiteboard charts to a portfolio database that fits the business. Here, the team will set up, manage and visualise their portfolio data within a graph database.
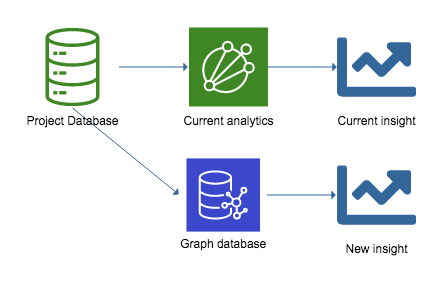
- Gain insight on project dependencies for an existing portfolio Portfolio is working well, and recorded well either in spreadsheet, or relational database, or Project Management System. Team wants to gain insight into how projects and objectives relate to each other, and chooses to view the same data in parallel with a graph database. Here one runs a graph database alongside existing database, analytics and reporting.

- Reset a current portfolio with an appropriate data structure The Portfolio data model is no longer suitable for the type of new projects or current business environment. The portfolio is well recorded in spreadsheet, or relational database, or Project Management System, and the team wish to move their data across to a new data model using a graph database. Here, the team runs the portfolio from a graph database.
Why have a data-model at all?
-
A portfolio can consistently record the same type of data for each project
-
All project reports are directly relevant to the purpose of the portfolio and the way the company does business
-
Only relevant data is collected and recorded, avoiding bloat.
Why use a graph database?
Many good data models do not use graph-databases.
Graph databases work well for portfolios where:
-
there are many dependencies between projects and programmes
-
the data model needs itself to be changed over time, because of the dynamic nature of the business. For example, the SQL database tables or the Enterprise EPM projects categories keeps on becoming out-of-date as the team learns how to improve its understanding of the best way to deliver projects
-
Internal teams see and use the portfolio data in very different ways, and the teams need the ability to show multiple views of the same projects.
At what portfolio level should this be applied ?
Options:
-
Portfolio level: across all projects and programmes in the portfolio. Crucially, a portfolio level data model will emphasise links to Corporate Stakeholders and Departments, Business objectives, etc.
-
Programme level: For a large programme, a clear data model is invaluable for showing the dependencies between the subordinate projects, as well as the broader strategic drivers and operating context for the new capability delivered by the programme. This will ensure the programme data model can be used by the parts of the business which have commissioned the programme outcomes.
-
Project level. There are a number of mature project data models available, and at the project level it often makes the most sense to stick with the implied data model your team already uses for projects. i.e. the data model often ‘comes with’ the enterprise project management system you are using, whether an in-house system or Jira/Asana etc. There is probably no need for a graph database data model at project level unless your team is handling projects that have unique business contexts. However, a graph-based data model can be run in parallel if you are looking for additional insight in visualising the ways your projects fit together.
Summary of start-up steps for application
To get started, go to the relevant code and document library, which will have the appropriate steps.
Summary of steps
- Get an idea of the possible by looking at the examples provided
- Review what you currently record and track per project
- Sketch out what you would like to see for all projects
- Select your preferred level: portfolio, programme or project level
- Prepare 3 columns CSV representing what data is connected in your current portfolio (if any) e.g. |project| has |project risk|
- If each current data type have attributes, then record this in a CSV e.g. |Project Risk|Risk-description| Risk impact| Risk probability|
- Turn your to-be sketch into similar CSVs
- Import your CSVs into YEd Live or turn the CSVs into Cypher code and import them into Neo4j
- Look at the visualisations created from this import, and refine your data model.
This is now the data-model. One agreed, work on bringing in Instance data for all the projects.
There is an even faster method, which is to import all current data tables into Neo4j (including Instance data for all the projects), and then work directly on this new database to modify its data model until it suits what the team want it to be. This last method is easier for those experienced in Neo4j.
FAQs
What is a Data model ?
-The data model is what project attributes are consistently recorded and tracked in a given portfolio.
-For example, most projects will have data recorded for Scope, cost and schedule.
-It is often shown as a data schema.
-If the data is held in a relational database, then you may see shown as a series of tables, and joins between tables.
Where can we find the data model for our current portfolio ?
In most portfolios, the data model is either:
- implicit, and more or less the list of project attributes in a project spreadsheet
- implied by the project /portfolio management software used
- explicit, as a visual diagram showing the layout of project attributes within a portfolio relational database
- aspirational, comprised of whiteboard diagrams for a new project portfolio.
How many portfolios have good data-models?
Typically, a portfolio data model is in one of the following states:
-
evolved Over time, most projects have come to have similar records, but there is no formal data model
-
designed A data model and database has been designed based upon company needs
-
conflicted, where historical project records now do not sit well with the new projects being set up.
Which organisations will this help?
A clear data-model with a graph database is useful for companies that:
- run many projects or programmes, OR
- manage this portfolio in cloud Project Management system (Jira, Asana, Project online etc)or via their own documented Project framework, OR
- have project data in a database or spreadsheets or just within a cloud Project Management system
Acknowledgements
- Free products YEd Live and YEd are a good entry level to seeing the portfolio relationships as a graph
- provide Neo4j Desktop for running graph databases as a Community edition, along with a number of more sophisticated enterprise products.