When is evidence worth waiting for?
Six mountain-festival examples explore waiting, surveys, evidence latency and adaptive stopping. Inspect every policy path in the declared toy decision tree.
Explore evidence and commitment →Programme decision sequences
A first example
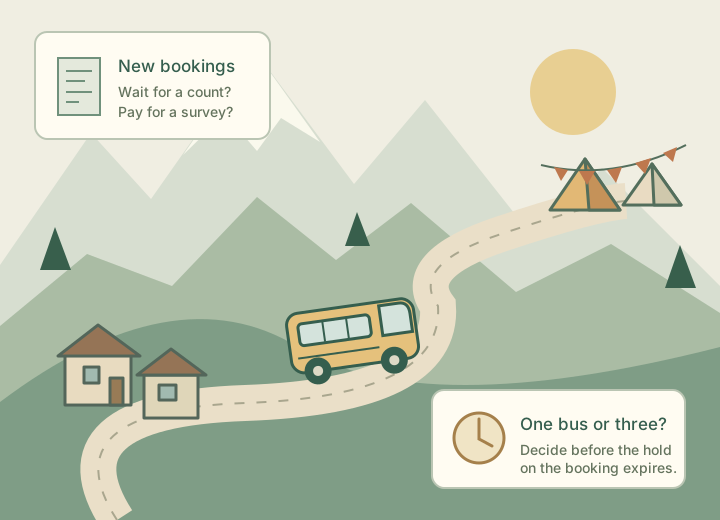
Evidence before commitment asks whether to reserve the shuttle now, wait for new bookings or commission a survey before the hire hold expires.
Eight experiments for exploring decisions that repeat over time. Start with a model, frame a real question, or play through a small example. Each tool keeps its own purpose and assumptions.
The numerical worlds are illustrative. The evidence essay solves its declared small model exactly; the simulators and game do not establish optimal policies or predict real programmes.
Six mountain-festival examples explore waiting, surveys, evidence latency and adaptive stopping. Inspect every policy path in the declared toy decision tree.
Explore evidence and commitment →Follow one realised path, compare four policy representatives, inspect a scenario tree and frame a recurring management decision around its information cadence.
Open the sequence model →Compare PFA, CFA, VFA, DLA and hybrid representatives using common seeded shocks. Keep world truth separate from belief; inspect benchmarks, paths, action ribbons and R/I/B framing.
Run the climate policy experiment →Write the narrative, state, actions, new information, transition rule and objective for a decision problem. Generate a readable summary of your own formulation.
Open the framing worksheet →Step through or play two fictional 2028 paths, inspect state/action/information narratives and export the diagram as SVG. Primary sources provide context for the example.
Explore the two paths →Work from a software-project narrative to core elements, a proposed mathematical model, policy design, evaluation and iteration. This guide explains a formulation; it does not run it.
Read the IT tutorial →Hire and allocate developers, commit a week's work, then receive uncertain bug and market information. Compare progress, quality, satisfaction and spend in the chart and full decision history.
Play the weekly project game →Inspect preserved path charts, action sequences, a Sankey view and an editable framing tool. Results are stored figures from an unavailable generating solver with unverified coefficients; controls do not rerun that solver.
Inspect the historical report →