A source → construction → limitation route
The original living graph-transform demo combined scheduling, transformations, formal aspirations and offer matching. This version keeps those strands accessible and makes their distinct meanings visible.
Read the transformations
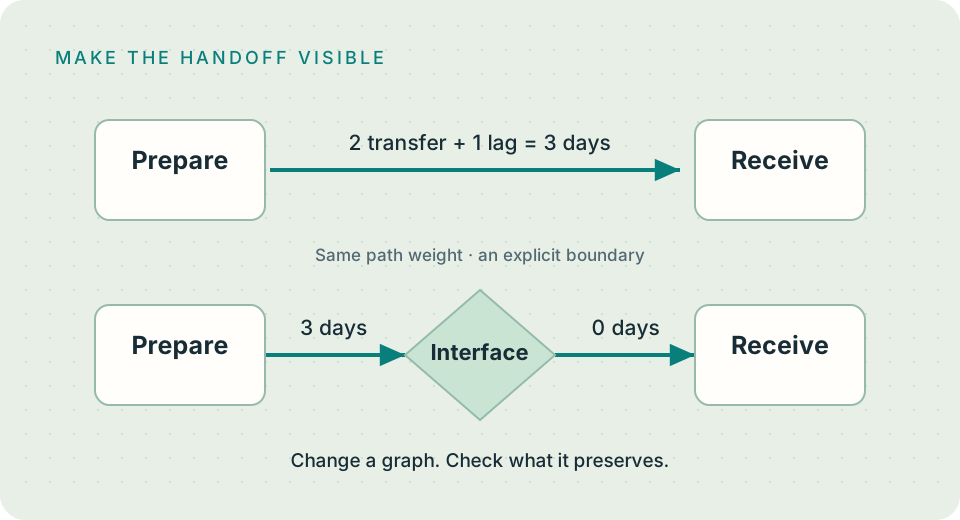
A ──3──▶ B
becomes
A ──3──▶ I ──0──▶ B
Subdivision: the new zero-duration interface makes the handoff explicit. In the default per-edge mode, original-node reachability and weighted paths are preserved. The comparison panel checks this on your current data.
Shared interface: A→I→B and C→I→D also permit A→D and C→B. Sharing a drawn junction can change the model. A group box that merely contains separate channels is a different construction.
Upstream pruning: if the only question is the selected outputs’ encoded prerequisites, retain their ancestors. This is a scoped view, not a declaration that the discarded work is irrelevant.
Three original Graphviz examples
Six sample files remain available below. The comments in the maintained expected outputs identify their scope. These are reference examples, not a “three tests passing” badge.
- Pruning input → expected upstream view: retain A→B→C→T; discard branches that cannot reach T.
- Interface input → expected edge subdivision: Eng→Ops and Ops→Finance gain separate interface nodes. This does not demonstrate a fibration or reduced coordination work.
- Mean/variance input → illustrative mean-path annotation: A→B→D→T has mean sum 7; A→C→D→T has mean sum 6. The file highlights the longer mean path.
Variance boundary: summing means is not computing the probability that a path finishes last. Means and variances alone do not determine the joint duration distribution. Shared tasks, covariance and distributional assumptions matter. No probabilistic critical path is computed here.
Formal questions, visibly bounded
A DAG can encode precedence. Mapping tasks to owner lanes is a grouping. Calling that grouping a fibration would require a specified category, projection and cartesian lifting property; no such construction is provided by this workbench.
The ordinary dependency calculation can serve as a comparison for Milestones under changing constraints. For a typed process-composition example, see Building a Wall. These are related enquiries with their own assumptions.
A model operation is not automatically a proof object. Snapshot history supports recovery; provenance needs recorded inputs, operation and result. Signed approvals and semantic correctness require additional evidence.
Original explanation strands, corrected
Open any short note. Each distinguishes the executable workbench from the original design aspiration.
Source and preserved intent
The source is Living Graph-Transform Rescheduler, fixed source revision 7888f8a. Its useful aim was to show local changes and their effects, inspect graph transformations, and explain change history. The historical design note and sample-checking note proposed more than the implementation supplied.
This maintained construction uses ordinary DAG arithmetic, ancestor traversal, a separate grouped view, edge subdivision, snapshot history and greedy offer matching. The original seven tasks, five-node sample and three matching presets remain. Unsupported claims about reversibility, signatures, probabilistic paths, vendor compatibility and fibrations are corrected.
Questions worth retaining concern what a representation preserves, when a boundary hides a dependency, what evidence makes a change explainable, and which extra semantics real work needs. They are questions, not a prescribed research programme or evidence of real project benefit. Preservation and limits record.